
Find your way
Lists and tables
Every VM, container, host and storage of all your clusters in tables you can sort, filter, rearrange, act on and export.
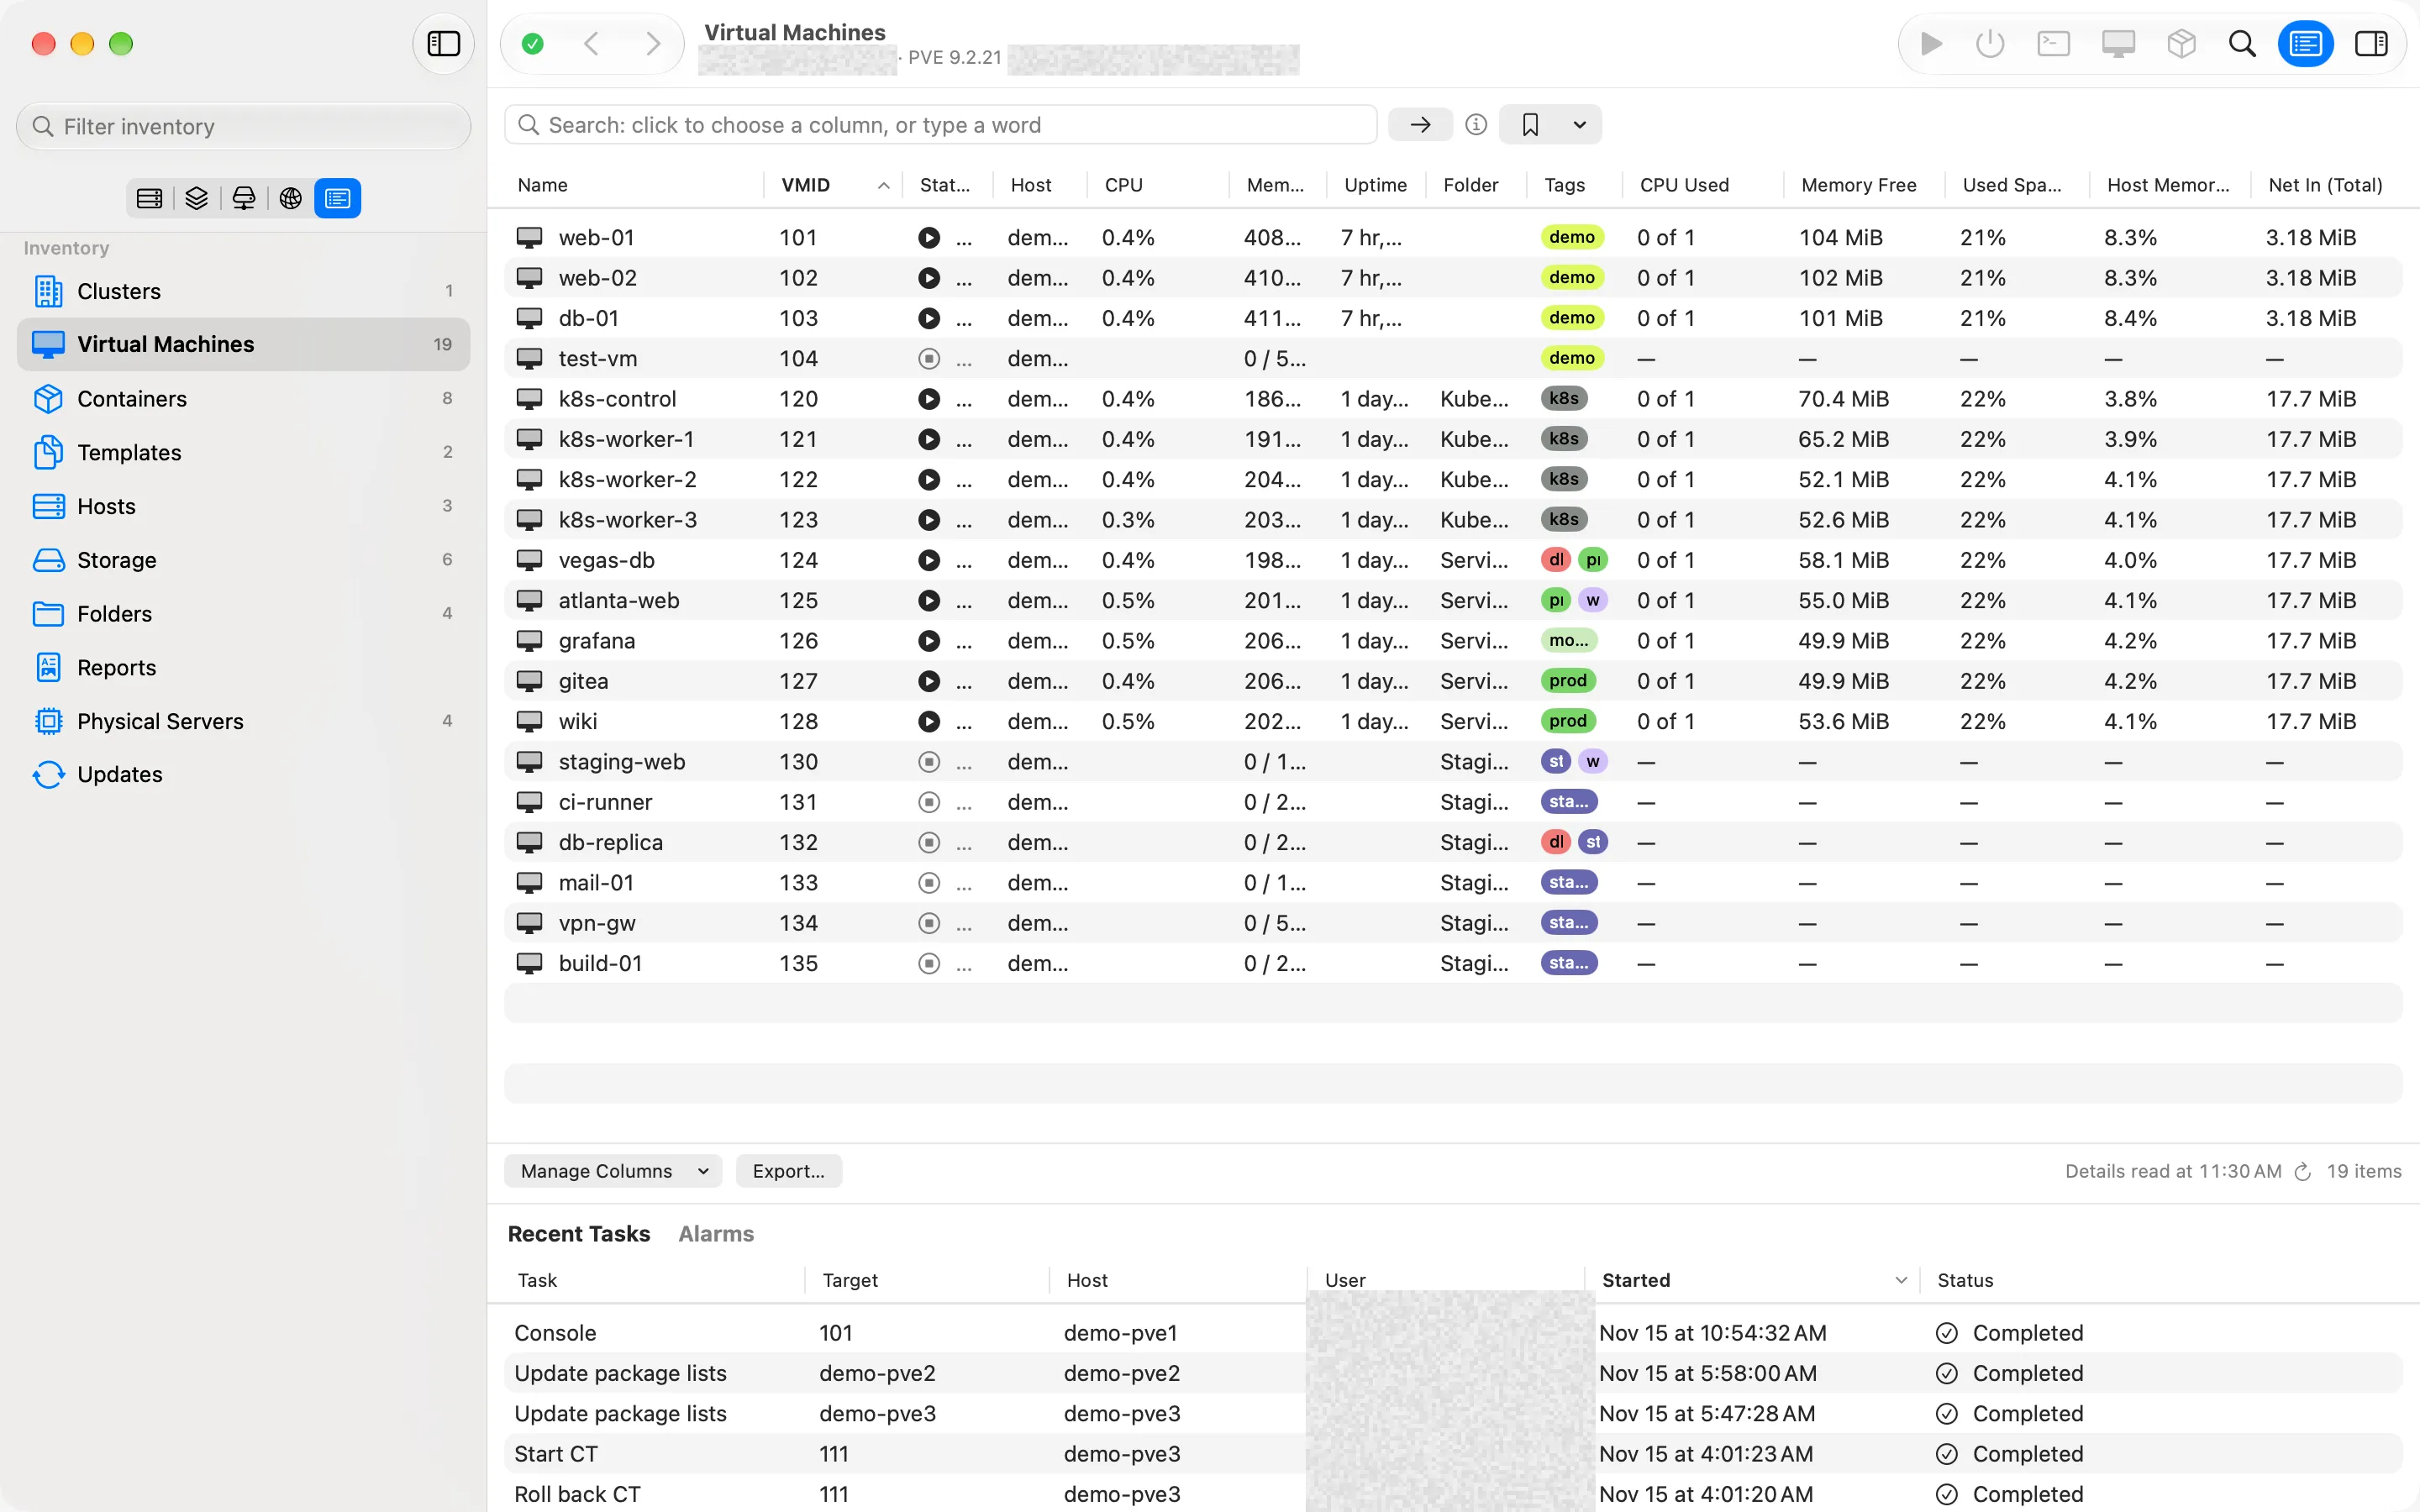
The inventory trees are good for finding one thing. When you want to see everything of one kind at once (every VM, every host, every storage) and compare them, choose Lists in the sidebar’s picker. It works like vCenter’s global inventory lists, across every cluster you’re showing.
The lists
The sidebar lists Clusters, Virtual Machines, Containers, Templates, Hosts, Storage and Folders, plus Reports (see Reports), and Physical Servers, the management controllers you’ve added (see Physical servers). The next version adds Updates, every host’s pending updates, Ceph, every cluster’s Ceph at a glance, Task Summary, the tasks of the last two days, and Firewall, every firewall’s state (all below).
Clusters shows each saved cluster with a usage chart and an All Clusters total.
Updates for every host
Coming in the next version.
Updates puts every host of every cluster you’re showing in one table: the Proxmox VE version it runs, how many updates are waiting, whether a reboot would start a newer kernel, and its repository status in words, such as “No Proxmox VE repository enabled”. Open a host’s row (right-click › Open Host Updates, or double-click on the Mac) to go to that host’s Updates page, where you refresh the package lists, read changelogs and upgrade.
The table is read when you first open it, and again when you press Refresh; the time it was read is shown above it. The pending count is as of each host’s last package refresh. Your sign-in needs the Sys.Audit privilege on a host to read its version and repositories, and Sys.Modify to read its pending updates; where it doesn’t have one, the row says Couldn’t read and names the privilege in Notes.
Ceph across clusters
Coming in the next version.
Ceph shows one row per cluster you’re showing: its Ceph health, capacity, available space and usage, how many OSDs are up and in, how many monitors are in quorum, its placement groups, whether every copy of the data is present, its fullest pool, and its health warnings. It reads each cluster when you first open it; Refresh reads them again.
- A cluster without Ceph says No Ceph.
- Redundancy says All copies present, or what share of the copies is degraded, misplaced or unfound, and how fast Ceph is recovering.
- Fullest Pool is the pool with the least room left: Ceph stops writing to a pool when it’s full, whatever the rest.
- A cluster your login can’t read says Couldn’t read, and its Notes name the privilege it needs: Sys.Audit or Datastore.Audit on /.
- Choose Open Ceph from a row’s menu (on the Mac, or double-click the row) to see that cluster’s Ceph page, where the changes happen.
Task Summary
Coming in the next version.
Task Summary counts the finished tasks of the last 48 hours on every cluster you’re showing: how many failed, how many ended with warnings and how many ended OK, by category (guest migrations, VM tasks, CT tasks, Ceph, HA, backups and other tasks) and by cluster, the cluster with the most failures first. It opens on every failed task; choose any count to list its tasks below, and open a task’s row (right-click › Open Task Log, or double-click on the Mac) to read its log. The Alarms pane shows the last hour; this page looks back two days.
It’s read when you first open it and again when you press Refresh. Anything that couldn’t be counted is said under the counts, never shown as zero: a host that’s offline or didn’t answer, and a host where your sign-in lacks the Sys.Audit privilege, where Proxmox VE lists only your own tasks. The table shows the newest 1,000 tasks of a count.
Firewall across clusters
Coming in the next version.
Firewall shows every datacenter, host and guest of the clusters you’re showing in one table: whether its firewall is on, its input and output policy, and how many rules it has (and how many of them are enabled). It reads each cluster when you first open it; Refresh reads them again.
- A host has no policy of its own. Its row shows the datacenter’s, marked “(datacenter)”.
- On (datacenter off) means the host’s or guest’s own switch is on, but nothing is filtered while the datacenter firewall is off.
- A guest’s firewall filters only the network devices that have Firewall ticked in its hardware.
- A row your login can’t read says Couldn’t read, and its Notes name the privilege it needs, such as Sys.Audit on /.
- Choose Open Firewall from a row’s menu (on the Mac, or double-click the row) to change its rules and options on its own Firewall page.
- If the datacenter firewall can’t be read, an “On” row’s note says so: while the datacenter is off, nothing is filtered.
Sort, select and act
- Click any column’s header to sort by it; click again to reverse the order.
- Double-click the divider between two column headers to size the column to fit its contents.
- Select several rows with ⌘ or ⇧, then use Actions to act on all of them at once, such as shutting down every selected guest. See Power and confirmations › Many guests at once.
- Right-click a row for its menu, including Copy for its name, ID or other values.
Choose your columns
Manage Columns under a table adds or removes columns, and Restore Default Columns puts the defaults back. Drag a column’s header to move it.
The guest tables have more than twenty optional columns. Some of the most useful:
- Guest OS, IP Address and MAC Address, read from each guest.
- Guest Agent: whether the QEMU guest agent is running.
- Oldest Snapshot: how long ago each guest’s oldest snapshot was taken, handy for finding snapshots someone forgot.
- CPU Used (CPUs busy, such as 1.4 of 4), Memory Free, Used Space %, Host Memory % and the network and disk totals since the guest started.
- Uptime, CPU Type, Machine, Firmware and TPM.
The host and storage tables offer CPU Used, CPUs, Memory %, Memory Free, Disk, Disk % and Disk Free.
Details that come from inside a guest fill in as each guest answers, with a count of how many have been read. The details read last time show at once when you open the app, dimmed until each guest is read again.
Filter
Type in the search bar above the table to keep only the rows that match, for example status = running, or let guided search write the query for you. See Search and Smart Folders. A search you use often can be saved as a Smart Folder.
Export
Export… saves the columns and rows you’re looking at as a CSV file, ready for a spreadsheet. For formatted PDF or HTML, use Reports.
Checked against Moxie Prox 1.3. Updated November 15, 2026.