
Monitor
Summaries and charts
Summary pages and live performance charts for the datacenter, hosts, guests, storage and folders.
Summary pages
Every datacenter, host, VM, container, storage and folder has a Summary. A host’s Summary has the same status panel as Proxmox’s: CPU, IO delay, load, memory, KSM, root disk and swap, CPU count, kernel, boot mode, manager version and repository status, plus notices about end of support and subscriptions.
The datacenter’s Summary shows health (quorum, nodes, Ceph), guest counts and resource gauges. Choose Storages… under Resources picks which storages its storage gauge counts.
In the VMs & Templates view, the datacenter’s Summary is about the guests: what the running guests are given against the hosts (vCPUs per host core, memory), the busiest guests by CPU and memory, guests per host, folder and tag, which are HA-managed and whether every guest is in a backup job, and what started, stopped, was created, destroyed or migrated in the last day. Every Summary packs its cards so a tall card leaves no gap beside a short one.
Each view’s datacenter Summary is about that view: in Storage, a table of every storage with how full it is; in Networking, the zones, VNets and every host’s bridges and bonds, and each zone has a page of its own. A cluster group has a Summary too (see Clusters and groups).
Charts
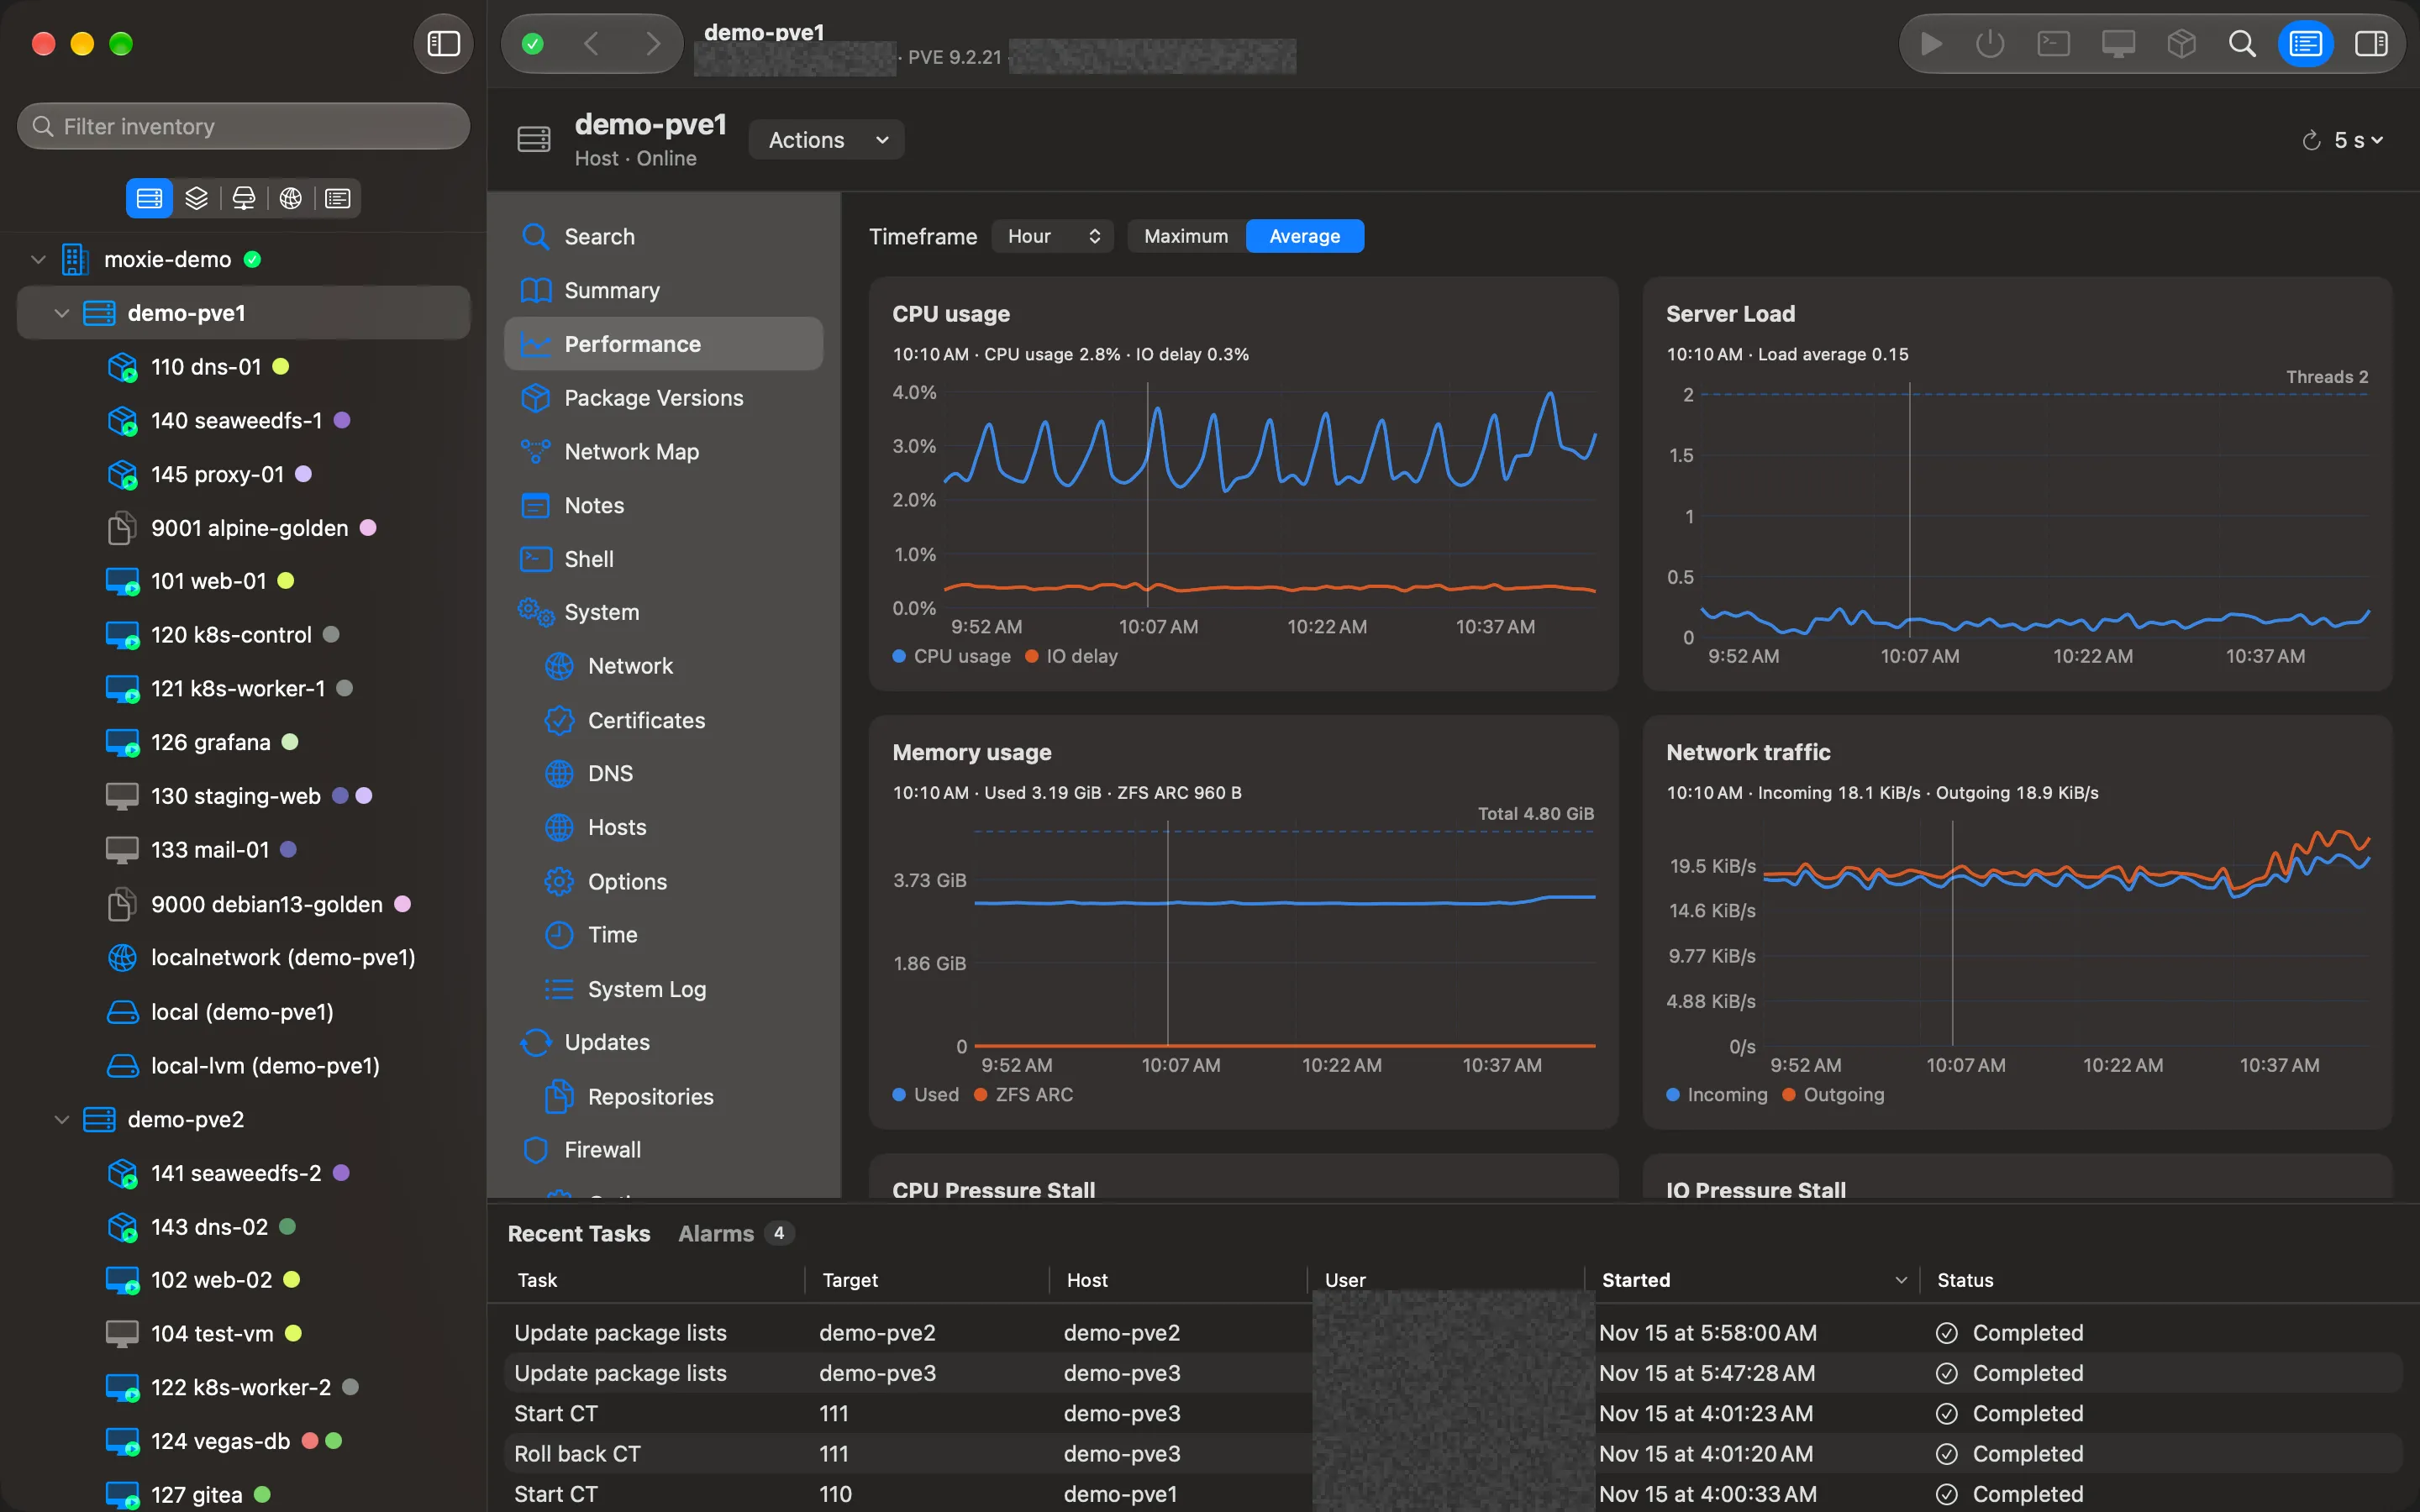
Performance (and Monitor on folders) charts the same metrics Proxmox’s web interface does:
- Hosts: CPU usage, IO delay, server load, memory (including ZFS ARC) and network traffic.
- Guests: CPU, memory, network and disk.
- CPU Pressure Stall, IO Pressure Stall and Memory Pressure Stall for hosts and guests: how long work waited for each.
Choose a timeframe (Hour, Day, Week, Month or Year) and whether to show the Maximum or Average of each interval.
Read a value
Point at any chart: the exact value at that moment appears in the chart’s header, and the same moment is marked on every other chart on the page, so you can line up a CPU spike with the network traffic that caused it.
Where the server has no samples, the line is grey and dashed, and the legend says so.
Checked against Moxie Prox 1.3. Updated November 9, 2026.